
- Quality Score is a 1-10 signal based on three factors: Exp. CTR (≈40%), Ad Relevance (≈30%), and LP Experience (≈30%).
- A QS of 1-3 increases your effective CPA by up to 163% versus a QS 6-7 baseline. A QS of 10 reduces it by up to 50%.
- The fastest wins are usually in Ad Relevance (rewrite headlines to include the keyword) and LP Experience (match the page headline to the ad copy, improve load speed).
Quality Score is Google's 1-10 rating of how relevant your keyword, ad, and landing page are to the person searching. It directly influences how expensive your clicks become and how competitive your ad rank is (Google Ads Help Center, 2026). In practice, most Swiss SMB accounts I audit sit in the 4-6 range on their primary keywords, which usually means avoidable inefficiency is sitting in plain view. Once your QS is above 7, the next lever is linking GA4 to Google Ads so Smart Bidding has reliable conversion data to work from. This guide covers what each component means and the specific changes that actually move the number.
What is Quality Score and why does it matter?
Quality Score is a diagnostic metric Google calculates at the keyword level, displayed in your Google Ads interface as a number from 1 (lowest) to 10 (highest). It is not a direct input into the auction - what actually determines your ad position and cost is Ad Rank, which Google calculates as: Quality Score × Maximum Bid × expected impact of ad extensions.
This formula has a practical implication: a competitor with a higher Quality Score can outrank you while paying less per click.
Situation: You and a competitor are both bidding on "Google Ads Agentur Zürich"
| Advertiser | Max Bid | Quality Score | Ad Rank | Result |
|---|---|---|---|---|
| You | CHF 8.00 | 4 | 32 | Position 2, higher CPC |
| Competitor | CHF 5.00 | 8 | 40 | Position 1, lower CPC |
Ad Rank = Max Bid × Quality Score. The competitor bids less, ranks above you, and still pays less. This is why QS improvements compound.
This directly affects how far your Google Ads budget goes. Our Google Ads management service always prioritises QS before scaling spend. Google's incentive is simple: more relevant ads usually attract more clicks and create a better user experience, so the auction rewards relevance rather than raw bid alone.
The score is recalculated continuously and shown as an average in your interface. According to Google's Quality Score documentation, a keyword needs approximately 30 impressions before Google shows a numeric score - below that threshold, you will see dashes instead of a number.
What are the three components of Quality Score?
Each keyword's Quality Score is built from three sub-scores, each rated as "Above average", "Average", or "Below average":
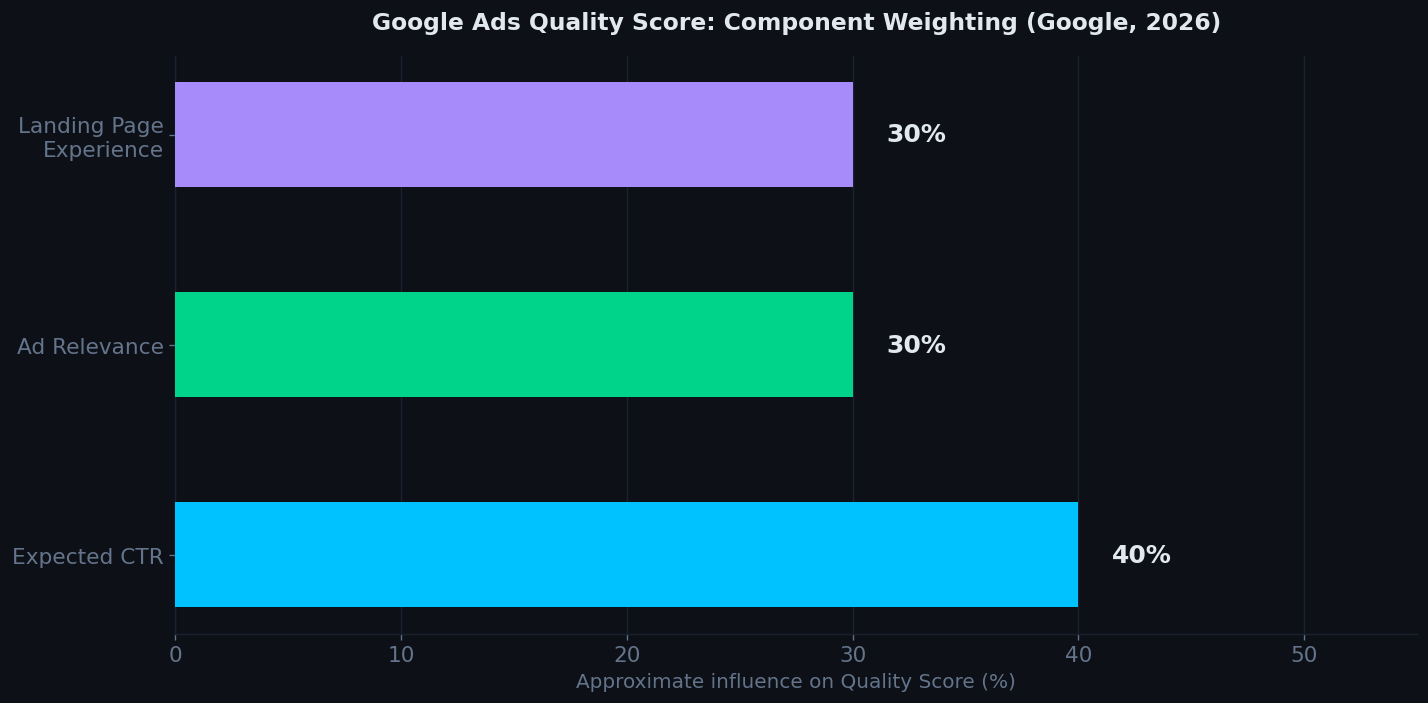
| Component | Measured by Google | Weight | Fix |
|---|---|---|---|
| Exp. CTR | Predicted click probability vs. competitor CTR on the same keyword | ~40% | Ad copy, headline structure, match type |
| Ad Relevance | How closely ad copy matches keyword intent | ~30% | Headline keyword inclusion, ad group structure |
| LP Experience | Page content relevance, load speed, mobile usability | ~30% | Page copy, load speed, navigation clarity |
You can see each sub-score in Google Ads by going to Keywords > Columns > Modify columns > Quality Score. Add "Exp. CTR", "Ad relevance", and "Landing page experience" as separate columns. This diagnostic view tells you exactly which component is dragging down each keyword's score.
How does Quality Score affect your CPA and Ad Rank?
The relationship between Quality Score and cost is non-linear. The difference between QS 4 and QS 7 is larger than the difference between QS 7 and QS 10, because Ad Rank is a multiplicative function. Here is how the cost impact looks across the full range, benchmarked against accounts managed across the DACH region from 2020 to 2026:
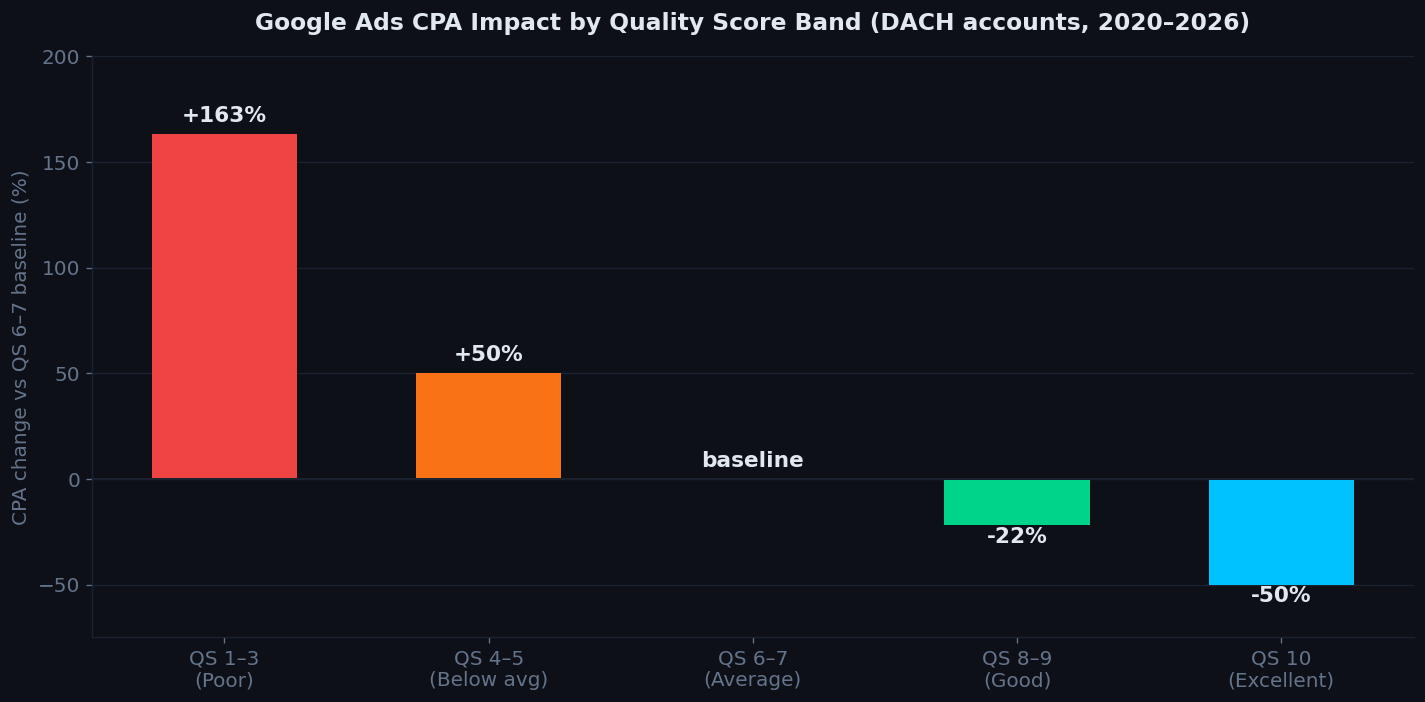
The practical implication: for a campaign spending $2,000/month on a keyword cluster with average QS 4, bringing that to QS 7 is roughly equivalent to reducing spend to $1,300/month for the same number of conversions. That difference pays for a landing page redesign, a copywriting review, or several months of management fees.
How do you improve Exp. CTR?
Exp. CTR is the most influential component and the one that surprises most advertisers: Google does not measure your actual CTR in isolation. It compares your predicted CTR to other advertisers who have shown ads for the same keyword. If your CTR is 4% but competitors average 6%, your expected CTR component is below average despite what looks like decent performance.
The highest-impact changes for Exp. CTR:
- Use the keyword in Headline 1. Ads with the target keyword in the first headline consistently outperform those that bury it. "Google Ads für Umzugsunternehmen" in Headline 1 beats "Professionelles Online-Marketing" every time for that specific query.
- Use Dynamic Keyword Insertion (DKI) selectively. DKI automatically inserts the search term into your headline, which boosts CTR for exact and phrase match campaigns. Avoid it for broad match - the inserted terms can be irrelevant and confusing.
- Add ad extensions aggressively. Sitelinks, callouts, structured snippets, and call extensions visually expand your ad, increasing click surface area. Ads with full extension coverage show higher CTRs across nearly all industries.
- Test Responsive Search Ads (RSA) asset combinations. After 2,000+ impressions, check the asset performance labels in your RSA. Remove "Low" rated headlines and replace them with tighter keyword-intent matches. Over 4-6 weeks, this consistently lifts CTR by 15-30%.
How do you improve Ad Relevance?
Ad Relevance measures how closely your ads match the intent of the keyword. The most common cause of "Below average" Ad Relevance is a structural problem: an ad group containing too many loosely related keywords, all shown the same generic ad copy.
The fix is tighter ad group segmentation:
- Group keywords by a single intent. "Umzug Zürich" and "Umzugsunternehmen Zürich" belong together. "Umzugskartons kaufen" belongs in a separate ad group because the intent is product purchase, not service hire - and the ad copy needs to differ.
- Write ads that could only be for this specific keyword group. If your ad copy would work equally well for five different keyword groups, it is probably not relevant enough for any of them. The more specific the headline, the higher the relevance score.
- Match the search query language exactly. If the keyword is "GA4 Conversion Tracking einrichten", the ad should contain "Einrichten" or a direct synonym - not just "GA4 Experte" which Google reads as adjacent but not directly on-intent.
How do you improve LP Experience?
LP Experience is evaluated by Google's crawler and rated on three factors: relevance of the page content to the keyword and ad, page load speed on mobile, and navigational transparency (can users find what they need without tricks or confusing design).
Most "Average" or "Below average" landing page scores in Swiss SMB accounts come from one of three problems:
- Page headline does not match the ad headline. If your ad says "Google Ads für Handwerksbetriebe - kostenlose Beratung" but the landing page headline is "Ihr digitaler Marketingpartner", Google sees a relevance gap. The page headline should echo the core promise in the ad - ideally with the target keyword in the H1.
- Page load speed on mobile is over 3 seconds. Use PageSpeed Insights (pagespeed.web.dev) to test. Anything above 3 seconds hurts both Quality Score and conversion rates. The most common fixable issues: unoptimised images, render-blocking scripts, no lazy loading.
- Sending all traffic to the homepage. The homepage is almost never the right landing page for a specific keyword. A keyword like "Umzugsunternehmen Zürich Kosten" should land on a page specifically about Zürich moving services and pricing - not a general homepage that makes the user hunt for information.
In client accounts: what a Quality Score fix looks like in practice
Across client accounts, one of the most consistent patterns I see is accounts where Exp. CTR and Ad Relevance are "Above average" but LP Experience is dragging the overall score down to 5 or 6. The ads are doing their job - people are clicking - but the page does not deliver on the ad's promise, and Google knows it.
A concrete case: a carpentry business in the Zürich area was running ads for "Schreiner Zürich" with a Quality Score of 5 on its primary keyword. The ads had strong CTR - a QS component of "Above average" - but the landing page was the site's general homepage, which loaded in 6.2 seconds on mobile and made no specific mention of Zürich or custom joinery. Google's crawler read it as a generic trades page, not a Zürich-specific carpentry offer. Ad Relevance was "Average", LP Experience was "Below average".
The fix involved three changes: a dedicated Zürich landing page with "Schreiner Zürich" in the H1, reduced load time to 2.1 seconds via image compression, and a consistent CTA (request a carpentry quote in Zürich) that matched the ad copy. Within 3 weeks, Quality Score moved from 5 to 8 on the primary keyword. CPC dropped from $4.20 to $2.90 - a 31% reduction - with no change in daily budget. The same spend generated 45% more clicks.
Benchmark data and market observations from Google Ads accounts managed by Dennis Westphal across Switzerland and the DACH region (2020-2026). Keyword volume data: DataForSEO March 2026. Industry context based on official Google Ads documentation.
In a free audit, I pull your full Quality Score diagnostic - keyword by keyword - and show you exactly which component is costing you the most. No pitch. Book a free audit →